Generated Maps of Original Land Owners
Updated 02/25/2019: See "Limitations" toward bottom
Of course, the original land owners were the Miami, Wea, Delaware, and other Indian peoples of our area displaced by the United States--and that is good to keep in mind--but I am talking about the purchasers of the original land patents from the U.S. government. It occurred to me while doing some research that it wouldn't be that difficult to write a program to automatically map these patents. So I did it.
You will note that there are no records for patents on section 16 of any township. This is because that section was originally set aside for the site and funding of a local public school.
View the site here. This is what it looks like (shrunk somewhat):
At the top-left is a "Select Township" button. Click it to get a mini-map of the area covered with each township labeled. Here you can click the portion you'd like to see mapped, and it will generate the plat for that area.
You can then toggle on/off the modern map overlay, the color code, plat borders, etc.
As you mouse over each patent row on the index, you will notice the corresponding plat turns yellow. If you click any row's Aliquots, the row will turn highlighted and the matching plat will stay yellow until you click that aliquot again to remove the highlight. That way you can scroll between the map and index to find particular properties.
Please note that some patents in the database are irregular--canceled or issued for land already issued once or referencing an island outside the grid--so if you find something in the index that is not on the map, that is the reason. If you click the Accession Number of any patent, it will take you to the Government Land Office page with more information. Occasionally, errors in transcription also lead to conflicting patent records. In any case, my program assumes the earlier patent is correct and maps it instead of the latter.
You can also download image files of each township to use for your own purposes--the link is next to the printer friendly links. So far, I've only generated versions with the present-day map overlay, so if you want maps without, you'll have to generate your own in the application and either print to PDF or screenshot them. I use an extension in Chrome called "Full Page Screen Capture" which works well. (Ideally the program would do this for you, but that would require server-side scripting which I don't have the time to work on now.)
Here is a massive, 11mb master map of the full area, should you want such a thing. The slight mismatch between sections is due to the township latitude/longitude averaging mentioned above.
Any time it detects a conflict of two patents seeming to be for the same square of land, it flags that square and highlights it in red, also highlighting the matching patent in the index. That way you can go look at it to see what's going on if that area interests you.
Some conflicts are also due to transcription errors from the BLM GLO, which I am gradually hunting down and fixing.
Let me know what you think! And let me know if you use it for any research, just because it would be cool to know someone made use of it.
 |
| Original Delphi Area Land Owners |
Background
If you've ever done research on early land records in, say, South Carolina, you know how arcane and headache-inducing that can be. What maps people have put together look like the plans to medieval villages. Fortunately, by the time the United States set about settling the Northwest Territory, they had passed the Land Ordinance of 1785, which provided an orderly grid system by which Indiana was surveyed.
Basically, what you need to know is that the state is divided into a grid which is numbered from north to south by Township line (22 North, for example), and from east to west by Range line (22 North Range 2 West, which contains Mulberry, is directly west of 22N R1W, which contains Cambria.) Each of these squares is in turn divided into 36 numbered sections, as depicted above.
I took data from the Bureau of Land Management General Land Office Records, which provides images and transcriptions of the original land patents issued in the area, and wrote a web application that parses that data and generates interactive maps. The data is generally laid out like so:
 |
| The PLSS Grid System |
Basically, what you need to know is that the state is divided into a grid which is numbered from north to south by Township line (22 North, for example), and from east to west by Range line (22 North Range 2 West, which contains Mulberry, is directly west of 22N R1W, which contains Cambria.) Each of these squares is in turn divided into 36 numbered sections, as depicted above.
I took data from the Bureau of Land Management General Land Office Records, which provides images and transcriptions of the original land patents issued in the area, and wrote a web application that parses that data and generates interactive maps. The data is generally laid out like so:
| Date | Names | Township/Range | Aliquots | Sec |
| 01/30/28 | PENCE, JOHN | 021N - 001W | E½ | 10 |
| 04/02/29 | PENCE, JOHN | 021N - 001W | E½NE¼ | 8 |
| 04/02/29 | PENCE, JOHN | 021N - 001W | E½NW¼ | 9 |
So that second patent indicates that John Pence was issued the eastern half of the north-east quarter of section 8 of Township 21 North, Range 1 West. (The first patent, the eastern half of section ten, is present day downtown Frankfort, as you might have guessed by the name John Pence.)
 |
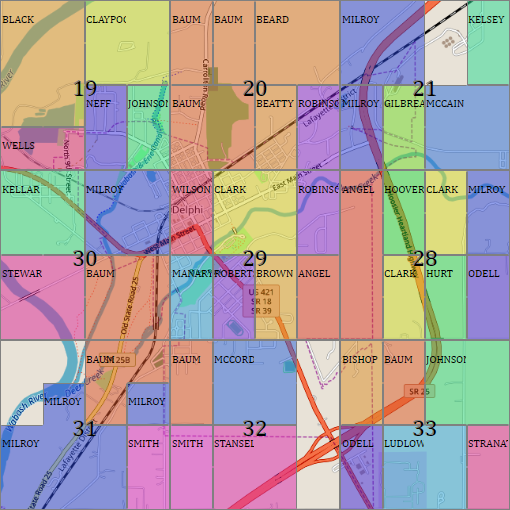
| Original Land Owners of Frankfort Area, Basic Map (left) and Overlay On Modern Map (right) |
You will note that there are no records for patents on section 16 of any township. This is because that section was originally set aside for the site and funding of a local public school.
The Patent Platter Application
Be forewarned: this application does not work in Internet Explorer. You'll need to access it in Chrome, Firefox, etc. You can also just download the gigantic master map linked at the bottom and zoom in on that, but of course you'll be missing out on all the features I'm about to explain.
 |
| image of the application |
At the top-left is a "Select Township" button. Click it to get a mini-map of the area covered with each township labeled. Here you can click the portion you'd like to see mapped, and it will generate the plat for that area.
 |
| image of the application |
You can then toggle on/off the modern map overlay, the color code, plat borders, etc.
The Map
In order to keep the map readable, each plat is labeled with only the last name of the first owner listed, and that name is cut off if it gets too long. But you can click any plat on the map and the full information for it will pop up, along with a link to the full record at the GLO where I got my data (and where you can see an image of the original patent paper) as well as a link to automatically search the land records at the Indiana Archives (more on why you might want to do that below).
 |
| an original land patent from the BLM GLO |
If you notice road/county lines running just offset from the property lines as generated and wonder if that means my map is somewhat off, you are right: it is. Or rather, the surveyors were slightly off. Or rather, the earth was slightly off by being a sphere covered in swamps and obstacles instead of a flat plane. Which is to say the real-world grid is not perfect, and many townships as surveyed tilt slightly, wander, etc. I averaged the latitude/longitude coordinates of each township's corners to get estimated midpoints from which to generate the bounding boxes I used in matching the modern map to my ideal generated map.
There are also many gaps in the data that seem particular to certain areas, but I do not know why that is--whether that land was never sold under this system, or was only sold later, or what.
Moving Through The Timeline
Above the map, you will notice an "Animate" button above a long slider. That slider is a timeline, and if you hit "Animate" it will cycle from just before the earliest patent had been issued in that area and you can watch the township settlement progress as it happened. (One caveat: this is based on the date the patent was issued, which due to how busy the land offices were could be over a year after the land was actually purchased. If you want to know what date it was purchased, you have to search for the receipt in the land records database from the Indiana Digital Archives. Since my database contains over 6,000 patents, I could not do so for everyone myself, but if you click any plat on the map it will provide you with a link to automatically search the relevant archives for that owner's name.) You can also just use the slider to scroll through time manually.Using the Index
Below the map is an Index table of all the patents for that area. You can sort by name, date, or section, and filter by name or section using the text inputs at the top. As you type into the filter input, it will eliminate non-matching plats on the map at the same time it eliminates them in the table. So if you type "a," the map will only show you properties owned by people with last names starting with "a."As you mouse over each patent row on the index, you will notice the corresponding plat turns yellow. If you click any row's Aliquots, the row will turn highlighted and the matching plat will stay yellow until you click that aliquot again to remove the highlight. That way you can scroll between the map and index to find particular properties.
Please note that some patents in the database are irregular--canceled or issued for land already issued once or referencing an island outside the grid--so if you find something in the index that is not on the map, that is the reason. If you click the Accession Number of any patent, it will take you to the Government Land Office page with more information. Occasionally, errors in transcription also lead to conflicting patent records. In any case, my program assumes the earlier patent is correct and maps it instead of the latter.
Printing
I encourage you to take, reproduce, and use these maps however you'd like. With that in mind, I've added "Printer Friendly" links below the map which basically just eliminate extraneous interactive controls so you can get a clean printout. You can get the map only, index only, or both. After going into printer friendly mode, you can revert to get the controls back by clicking the title at the top.Map Images
 |
| Master map of entire area |
You can also download image files of each township to use for your own purposes--the link is next to the printer friendly links. So far, I've only generated versions with the present-day map overlay, so if you want maps without, you'll have to generate your own in the application and either print to PDF or screenshot them. I use an extension in Chrome called "Full Page Screen Capture" which works well. (Ideally the program would do this for you, but that would require server-side scripting which I don't have the time to work on now.)
Here is a massive, 11mb master map of the full area, should you want such a thing. The slight mismatch between sections is due to the township latitude/longitude averaging mentioned above.
Limitations
Of course, not every piece of land sold was a perfect square. Some patents--often those in sections falling over bodies of water--are fractional, so that instead of simply being the SW quarter of the SW quarter, it will be the SW Fraction of the SW Quarter, referring roughly to how the river or whatever divides that portion of land. It may also refer to lot numbers, etc. My system cannot plot these, so it does its best to map them as if they were normal plats and flags them as irregular when this causes overlaps.Any time it detects a conflict of two patents seeming to be for the same square of land, it flags that square and highlights it in red, also highlighting the matching patent in the index. That way you can go look at it to see what's going on if that area interests you.
Some conflicts are also due to transcription errors from the BLM GLO, which I am gradually hunting down and fixing.
Improvements
I need to clean up my code before I post it on Github, but it is open source, such as it is. There are far more efficient approaches to interpreting the data--they occurred to me halfway through doing my terrible approach--but for now, since it works it works. I am open to anyone pointing out bugs, making suggestions, or taking any part of it to make their own.Let me know what you think! And let me know if you use it for any research, just because it would be cool to know someone made use of it.


I wouldn't worry too much about cleaning up your code before posting it to GitHub. I'd wager that most of the code that runs our modern world is pretty ugly.
ReplyDeleteHa! Good point. Thanks.
Delete